See It in Action
Click any screenshot to view it full size.
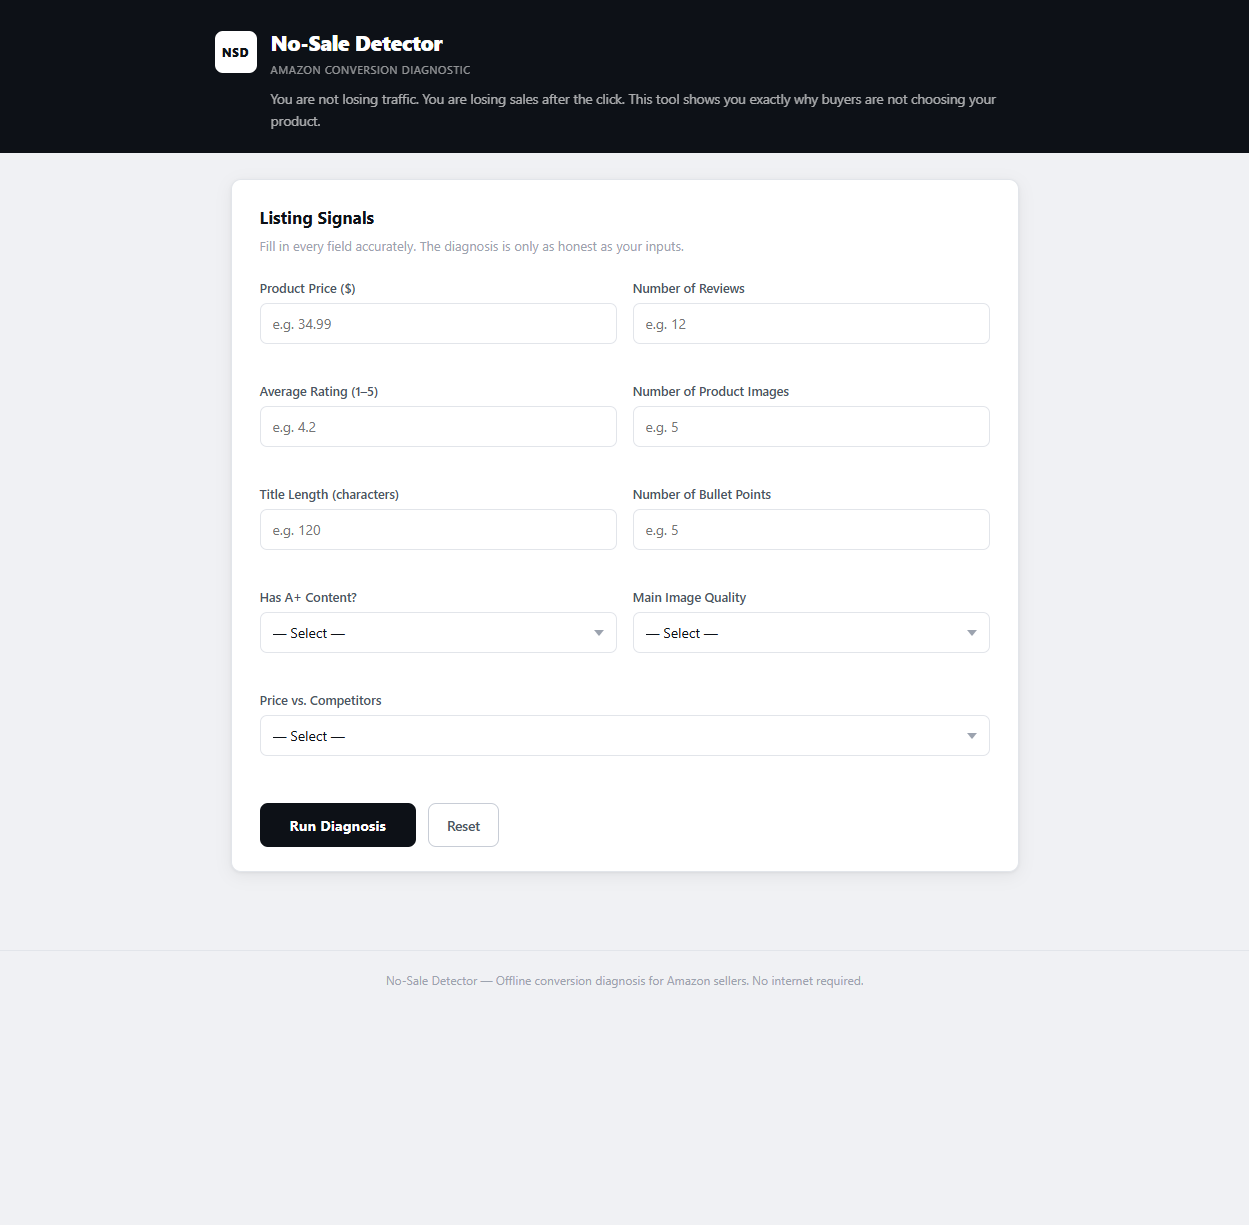
The Input Form
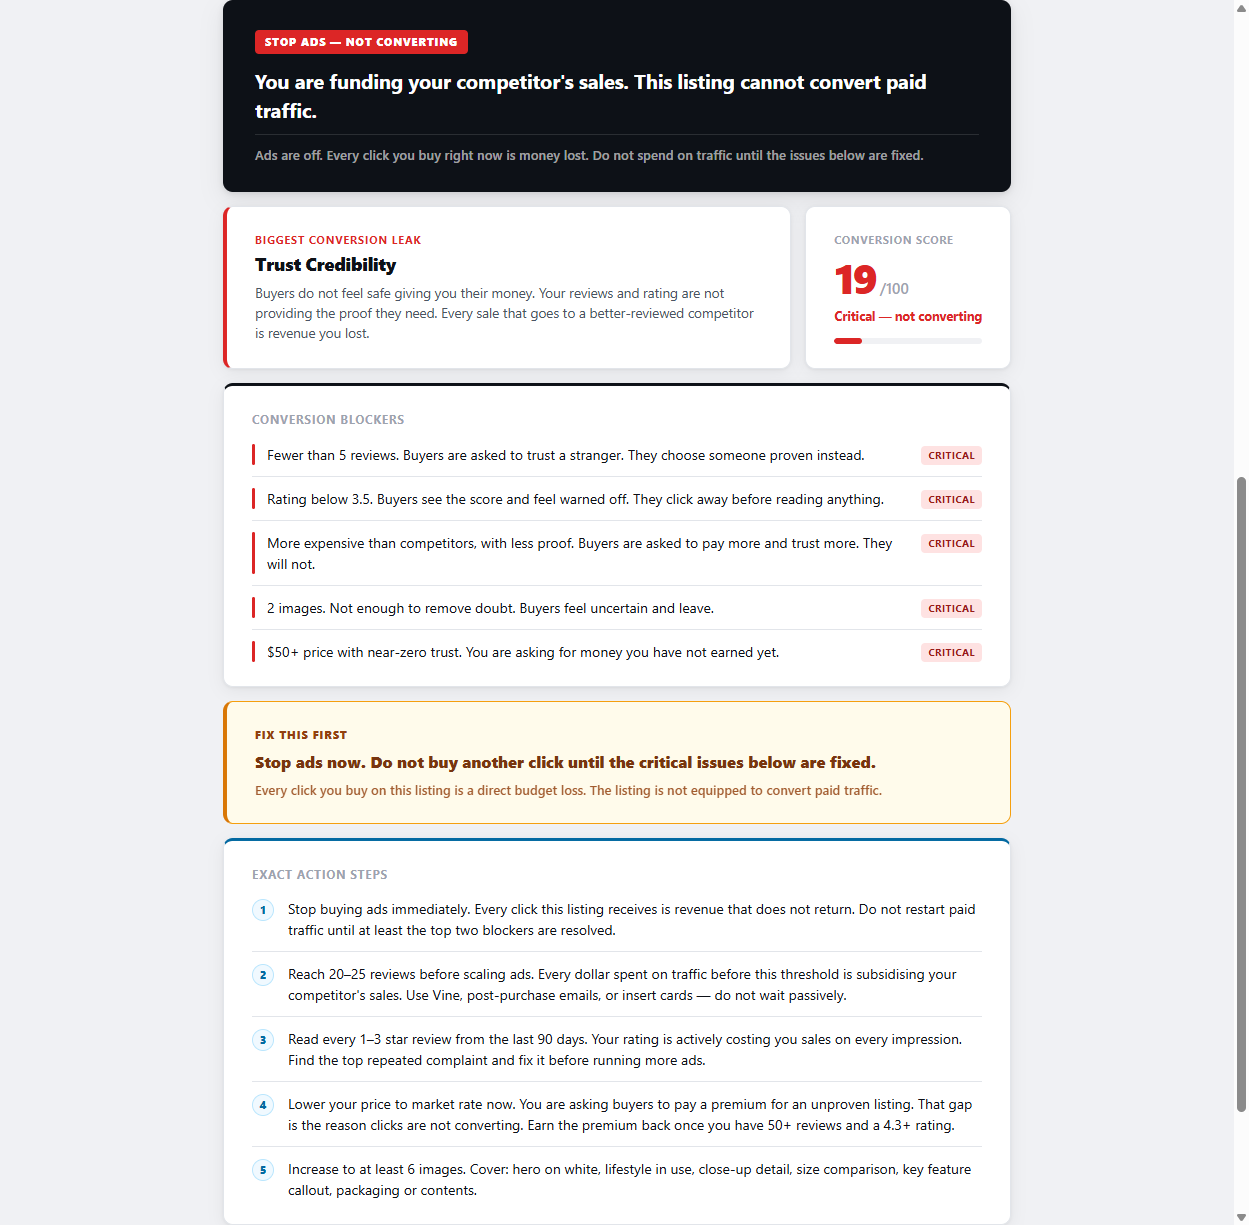
Critical Result — Score 19
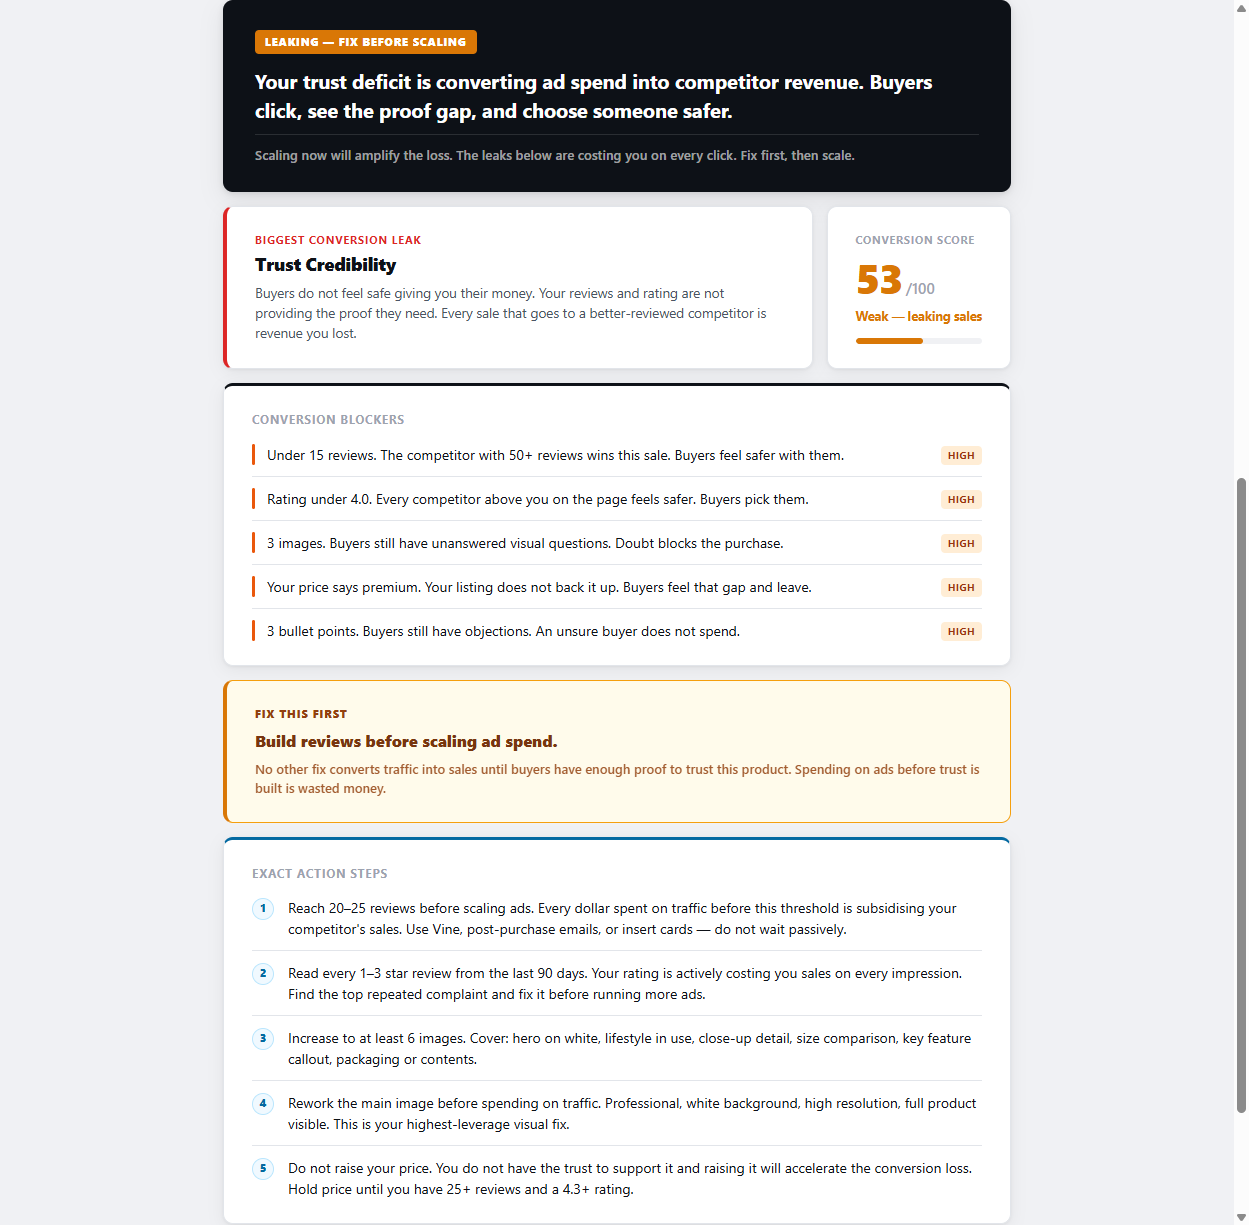
Mid Result — Score 53
Amazon Listing Conversion Diagnostic
Most sellers blame their traffic. The problem is almost always the listing. No-Sale Detector diagnoses exactly which conversion failure is costing you the most — and tells you what to fix first.
Get the Diagnostic Tool →One-time purchase · No account · No internet required · Windows & Mac
Before you change your price, pause your ads, or rewrite your bullets at random — check if you recognise any of these patterns. They all point to the same root: a listing that is not doing its job.
Warning Sign
Buyers are finding your listing and clicking it. Something on the page is stopping them from completing the purchase.
Warning Sign
Your ads are running. Clicks are coming in. But the cost per sale keeps climbing because conversion is too low to justify the spend.
Warning Sign
Seller Central shows sessions on your listing every day. But order volume is flat or falling. Visitors are arriving and leaving without buying.
Warning Sign
You rank on page one for a keyword. Traffic is real. But the revenue does not reflect it. The listing is failing to convert the organic traffic it has earned.
Warning Sign
Sponsored ads convert because intent is high. Organic traffic converts poorly because it includes people earlier in the buying journey — and the listing does not bridge that gap.
Warning Sign
Nothing changed on your listing — but conversion fell. A competitor improved their listing, or a review pattern shifted buyer perception. The bar moved without you.
Before diagnosing your listing, you need to know what the numbers actually mean. Conversion rate on Amazon is calculated as:
Conversion Rate (%) = (Number of Orders ÷ Number of Sessions) × 100
You find sessions and unit session percentage inside Seller Central under Business Reports → Detail Page Sales and Traffic. Here is how to read what you see:
| Conversion Rate | Traffic Type | Status | What It Means |
|---|---|---|---|
| 0–4% | Organic | Danger | Serious listing problem. Stop scaling ads immediately. |
| 5–8% | Organic | Below Average | At least one significant conversion blocker present. |
| 10–15% | Organic | Healthy | Listing is working. Focus on scaling traffic. |
| 15%+ | Organic | Excellent | Strong listing-market fit. Maximise traffic now. |
| 3–8% | Sponsored Ads | Normal | PPC traffic is colder. This range is typical. |
| <3% | Sponsored Ads | Review Keywords | Keywords may not match buyer intent. Check search term report. |
Note: Benchmarks vary by category. High-ticket items and consumables convert differently. Compare your rate against direct competitors in your category, not global averages.
When a buyer clicks your listing and leaves without buying, something on your page failed. It is rarely one thing. It is almost always a combination of signals that, together, made the buyer feel uncertain enough to leave. Here is every major cause — and what drives each one.
Your main image runs in search results before anyone reaches your listing. It determines whether you get the click in the first place. A main image that looks small on a white background, shows packaging instead of product, or lacks sharpness will lose clicks to competitors before your listing has any chance to convert. Even if buyers do click through, a weak main image sets a low-quality expectation that every other element on the page has to overcome. Main image quality is the highest-leverage, lowest-cost fix available to most sellers. Test it before changing anything else.
Amazon buyers use reviews as a proxy for risk. Fewer than 15 reviews, a rating below 4.0 stars, or a pattern of repeated complaints in recent reviews creates a trust gap that no price cut or image upgrade can close. Buyers do not consciously evaluate your review count — they feel the absence of confidence and leave. A product with 400 reviews at 3.7 stars is fighting a perception problem that listing copy cannot fix. The review situation needs to be addressed at its source: the actual product experience, the packaging, and the expectation the listing sets.
Every price point requires a corresponding level of visible proof. A product priced at the top of its category needs images, copy, reviews, and A+ content that justify that premium. If the listing does not deliver enough evidence of value to match the price, buyers choose the cheaper alternative — even if your product is actually better. The inverse is also true: an unusually low price with weak listing signals can trigger distrust. Buyers wonder what is wrong with it. Price and listing quality need to be calibrated together.
Bullet points are where the sale is won or lost. Most sellers use bullets to list specifications. That is a mistake. Buyers already know they want a product in your category — they are evaluating whether yours is the right one. Bullets need to answer the questions buyers are silently asking: Will this fit? Will it last? Is it compatible with what I have? Will I regret this? The fastest way to find those questions is to read the negative reviews of your top three competitors. The recurring complaints are the objections your bullets need to address.
Sometimes the conversion problem is not a listing problem. It is a product problem. If your product does not solve the problem buyers are searching for, or does not solve it as well as alternatives, no listing optimisation will close that gap sustainably. Signs of product-market fit issues include consistent negative reviews that describe the same core disappointment, a conversion rate that does not respond to listing changes, and organic rank that improves but revenue does not follow. If this is your situation, the diagnosis is important — you need to know before you invest more in optimisation.
High click-through rate combined with very low conversion rate is often a keyword intent problem, not a listing problem. When your ads show up for searches that are informational rather than transactional — or when the keyword describes a product similar to but not the same as yours — you get clicks from people who were never close to buying. The search term report is the first place to look. If you are spending on keywords with zero or near-zero conversion over a statistically meaningful period, those keywords are pulling your overall conversion rate down without any redemptive value.
A buyer searching "best protein powder for weight loss" is in a different purchase state than one searching "chocolate whey protein 2kg". Your listing needs to speak to the intent of the traffic reaching it. If you are ranking for broad, high-volume keywords but your listing is written for someone already committed to buying your specific product, you will lose the majority of that broader traffic. The listing and the keywords that send traffic to it need to be aligned in intent, not just in topic.
A+ Content replaces the plain text description with image modules, comparison charts, and feature callouts that move buyers from consideration to decision. According to Amazon's own data, Basic A+ Content increases sales by up to 8%. Well-implemented Premium A+ Content can increase sales by up to 20%. If you are Brand Registered and have not built A+ Content, you are leaving conversion on the table with zero incremental cost. Even if you have A+ Content, it may be working against you if it is text-heavy, low-resolution, or does not address the core buying objections in your category.
No-Sale Detector scores your listing across all five conversion dimensions and ranks your blockers by impact — so you know exactly what to fix first, not what to guess at next.
Run the Diagnosis →The order matters. Do not start with bullets if trust is broken. Do not fix images if your price makes no sense. Work through these in sequence — each step removes a layer of conversion resistance.
Open your listing as a buyer. Count your reviews. Check your star rating. Read the most recent negative reviews. If you have fewer than 15 reviews, a rating below 4.0, or the same complaint appearing more than twice in recent reviews, this is your primary conversion blocker. Nothing else you do will overcome a trust deficit this significant. Use Amazon's Request a Review feature for every order between 5 and 30 days post-delivery. Consider Vine for new listings. If the complaints describe a real product issue, fix the product before optimising the listing.
Your main image is doing conversion work before buyers arrive on your page. It runs in search results. It sets expectation. It determines whether the click happens at all. If your main image shows a product that looks small, flat, or generic against white space — or if competitors' main images are visibly stronger — this is your highest-impact fix. The main image should show the product filling the frame, at the most compelling angle, with professional lighting. Test different crops and angles. Your CTR in search results will tell you if the change worked within days.
Look at your listing as if you had never seen it before. At your current price, does everything visible on the page justify what you are charging? Images, review count, star rating, bullets, A+ content — does the sum of these signals earn the price? If your price is above the category midpoint, every element of proof needs to be stronger than average. If it is below and conversion is still low, ask whether an unusually low price is triggering distrust. A price change without a listing change rarely solves a conversion problem. They need to move together.
Read the one-star and two-star reviews of your top three competitors. Identify the recurring complaints. These are the objections your buyers are carrying into your listing. Your bullets need to address them directly, before buyers have a chance to form doubt. Lead each bullet with a benefit, support it with a feature or specification, and close it by removing the specific objection that your competitor's reviews reveal. If your bullets could appear on any product in your category, they are not working hard enough.
If you are Brand Registered and do not have A+ content, build it now. If you have it, audit it honestly. Does it use high-quality images? Does it include a comparison chart? Does it address the core buying hesitations in your category? A+ content should answer the question: what would make a convinced-but-hesitant buyer finally say yes? It is not a place for brand story. It is a close. Design it to remove the last layer of doubt between "I'm interested" and "I'm buying."
Pull your search term report and sort by spend descending. For the top 20 keywords by spend, check: are people searching these terms ready to buy your specific product? A search for "office chair" is not the same intent as "ergonomic office chair lumbar support under 200". If broad, informational keywords are consuming budget and delivering zero or near-zero orders over 30-plus days, add them as negative keywords. Focus spend on the terms that describe exactly what your buyer is ready to purchase. This step alone often improves blended conversion rate measurably within two weeks.
These three scenarios cover the most common patterns. The underlying cause is different in each one — and so is the fix.
A seller is running PPC on a high-competition kitchen product. The main image is strong — it earns clicks. CTR is above category average. But once buyers land on the listing, the secondary image stack drops off: one blurry lifestyle shot, a spec sheet that is impossible to read on mobile, and no size comparison. Buyers click, scroll briefly, and leave. The listing creates enough desire to earn the click but not enough conviction to close the sale. Conversion is 3.8% on 400 weekly sessions.
Fix: Rebuild the image stack to close the sale — not just create interest. Add a lifestyle image showing the product in use, a benefit-led infographic that doubles as mobile-readable copy, and a size or scale comparison. Move the most persuasive image to position two, directly after the main shot. Conversion should begin moving within 7–14 days of the change.
A newly launched supplement has excellent photography, well-written bullets, and A+ content that clearly explains the product. But it has 9 reviews at 4.1 stars. When buyers compare it to three competitors with 300–800 reviews, the visual disparity in trust signals is significant. The listing is professionally built — but buyers cannot verify the product claim with the review volume they expect before spending money. Conversion sits at 4.2% despite strong traffic from a successful launch promotion.
Fix: Trust cannot be faked with copy. Enrol immediately in Amazon Vine if eligible. Activate the Request a Review button for every order. Consider running a promotional price to drive volume and review velocity. In the short term, be realistic: a listing with fewer than 25 reviews in a review-intensive category will convert below average regardless of listing quality. Build the social proof in parallel with listing optimisation — both are required.
A home goods seller has 180 reviews at 4.5 stars and a main image that consistently outperforms competitors in A/B tests. But the price is $12 above the next two alternatives, and the listing does not clearly communicate what justifies the premium. No material specification comparison. No proof of durability. No A+ content. Buyers see the price, glance at the page, notice that cheaper options have similar ratings, and leave. Conversion is 5.1% — below average given the strong review base.
Fix: Either reduce the price to within range of perceived parity, or build the proof that earns the premium. The second path is the better business: add A+ content with a competitor comparison chart, add a bullet specifically addressing durability with a concrete specification, and add a lifestyle image that signals the quality tier the price implies. The listing needs to earn the price before the buyer will pay it.
Every step in the framework above requires an accurate diagnosis before you start. Without knowing which conversion problem is costing you the most, you risk spending time and money fixing the wrong thing first. No-Sale Detector removes the guesswork.
You enter 9 signals from your Amazon listing. The tool scores your listing from 0 to 100 across five conversion dimensions and tells you exactly which problems are costing you the most — ranked by impact, with exact action steps tied to your specific inputs.
Dimension 1
Do buyers feel safe handing you their money? Reviews and rating diagnosis.
Dimension 2
Does your price match the proof your listing provides? Are you asking for more trust than you have earned?
Dimension 3
Can buyers clearly see what they are buying? Image quality and quantity diagnosis.
Dimension 4
Do your title and bullets answer buyer questions — or do they leave doubt that kills the sale?
Dimension 5
Are you giving buyers enough reasons to choose you over a competitor with similar trust and price?
Result
Score. Biggest leak. Ranked blockers. Fix-first command. Exact action steps.
One file. Unzip anywhere on your computer. No installation required.
Double-click to open in Chrome, Firefox, or Edge. No internet connection needed.
Price, reviews, rating, images, title length, bullets, A+ content, main image quality, price vs. competitors.
Score, ranked blockers, fix-first command, and exact action steps. Results in under 60 seconds.
Click any screenshot to view it full size.
The most common causes are a trust gap (too few reviews or a rating below 4.0), a weak main image that fails to communicate value, a price that is not backed by visible proof, bullet points that do not answer the objections buyers actually have, and keyword traffic that does not match the intent of someone ready to buy. These problems compound. A listing with two or three of these issues simultaneously will convert at a fraction of the category average — and no individual tweak will fix it. The correct approach is a structured diagnosis that ranks your blockers by impact, so you fix the right thing first.
Clicks without sales means buyers found your listing compelling enough to visit, but not convincing enough to buy. The gap almost always lives inside the listing — not in the traffic source. The most common specific causes are: a main image that earns the click but secondary images that fail to close the sale, a price that feels unjustified by the visible proof, fewer reviews than buyers expect before spending money in your category, and bullet points that list specifications instead of removing the real objections buyers carry. Check your unit session percentage in Seller Central. If it is below 8%, start the diagnosis there.
In rough order of impact: review count and rating, main image quality, price relative to visible proof, secondary image quality and sequence, bullet point clarity and objection handling, A+ content presence and quality, delivery speed and Prime eligibility, and keyword-to-intent match. Every one of these can be diagnosed and most can be improved without changing your product or your price. The difficulty is knowing which combination is costing you the most in your specific situation — that requires a structured diagnostic approach, not guesswork.
Start with diagnosis, not action. Identify whether your primary problem is trust (reviews, rating), visuals (images, A+ content), price (justified or not), or copy (bullets that do not answer objections). Then fix in this order: trust issues first, images second, pricing calibration third, copy fourth, and traffic targeting fifth. Common mistakes include changing images when the real problem is reviews, or rewriting bullets when the actual blocker is a price that buyers do not believe. Fix in the right order and test one element at a time.
For organic traffic, the Amazon average is 10–15%. A rate below 5% on organic traffic is a strong signal of a listing problem. Sponsored ads typically convert at 3–8% because the intent of ad-driven traffic is generally lower than someone who found you through organic search. If your organic conversion rate is below 8%, the listing needs attention before you scale ad spend further. Above 15% organically is excellent — at that point, the goal shifts to driving more traffic rather than improving conversion.
In Seller Central, go to Reports → Business Reports → Detail Page Sales and Traffic by ASIN. The column labelled "Unit Session Percentage" is your conversion rate. It is calculated as the number of units ordered divided by the number of sessions on your listing. Check it per ASIN, not as an account average. An account average masks individual listing problems — a high-converting ASIN can hide a completely broken one.
Sometimes, but it is rarely the right first move. Price affects conversion only when the listing's visible proof does not justify the current price point. If your trust signals (reviews, rating, images, A+ content) are strong, a price reduction often has little effect on conversion — buyers were not leaving because of the price. If trust signals are weak, a price reduction may not help either, because buyers do not yet believe the product enough to buy it even at a discount. Diagnose the actual blocker before adjusting price.
Yes. According to Amazon's own data, Basic A+ Content can increase sales by up to 8%, and well-implemented Premium A+ Content can increase sales by up to 20%. The impact is highest in categories where buyers need visual confirmation and reassurance before committing. If you are Brand Registered and have not built A+ content, this is one of the highest-leverage improvements available to you at zero incremental cost beyond the time to build it. If you have A+ content but it is text-heavy, generic, or fails to address the real buying hesitations in your category, it may not be doing meaningful conversion work.
Get a scored diagnosis of your Amazon listing in under 60 seconds. Find the conversion leak that is costing you the most — and the exact fix to apply first.